default_host_columns = name,state,last_check,duration,plugin_output
Dynamic Views
new in release v2.14
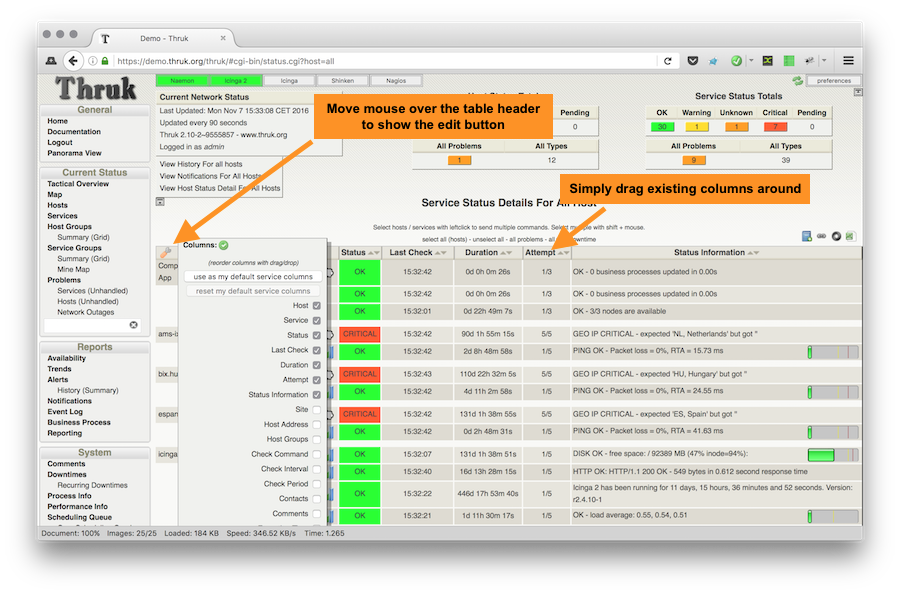
Dynamic Views are a way to customize the columns and layout of the host and service list pages.
Basically there are 3 ways to change the columns:
-
On the fly with the edit button (resets when you leave the page)
-
By setting a default view for your user in the edit menu above
-
By setting a default view in the main config file (thruk_local.conf)
Change columns on the fly
An easy way to temporary adjust the columns is to open the edit menu like shown in the image above. This change is just temporary and if you leave the page, the columns will be reset to their defaults.
Set default view for own user
To permanently save the columns layout for your user, you can hit the "use as my default … columns" button in the edit menu. Then the current layout will be saved for your account and used whenever you open a host or services list. Note that you can save a layout for host lists and one for service lists.
Set default view from main config file
There are two configuration options default_host_columns and default_service_columns
available to permanently set a default view for your users. Both options are
a comma separated list of columns, so they define the order and which columns
will be displayed.
ex.:
See the available columns list for a list of available columns.
Another example which sets reduced view for the contact_group managers with an additional column for the comments.
ex.:
<Group managers>
  default_host_columns = name,state,comments
  default_service_columns = host_name,description,state,duration,comments
</Group>
Available columns
Available columns for hosts are:
-
name
-
state
-
last_check
-
duration
-
plugin_output
-
peer_name
-
current_attempt
-
address
-
check_command
-
check_interval
-
check_period
-
contacts
-
comments
-
event_handler
-
execution_time
-
groups
-
latency
-
next_check
-
notification_period
-
percent_state_change
Available columns for services are:
-
host_name
-
description
-
state
-
last_check
-
duration
-
current_attempt
-
plugin_output
-
peer_name
-
host_address
-
host_groups
-
check_command
-
check_interval
-
check_period
-
contacts
-
comments
-
event_handler
-
execution_time
-
groups
-
latency
-
next_check
-
notification_period
-
percent_state_change
Available columns for overview are:
-
name
-
alias
-
address
-
state
-
services
-
actions
Adding custom variables
It is possible to display custom variables into their own column. Thruk will
automatically add all custom variables which are listed in the show_custom_vars
configuration option to the list of available columns.
Note that you need to add the custom variable to show_custom_vars or
expose_custom_vars, a simple * is not enough.
ex.:
default_host_columns = name,state,cust_LOCATION:Location
show_custom_vars = _LOCATION
Rename Columns
The columns header can be renamed by doubleclicking the header text or by changing the configuration directly. Simply add a colon followed by the new name.
ex.:
default_host_columns = name,state:Host Status,comments