{
  "general": {
    "host": "",
    "service": ""
  },
  "layout": {
    "x": "100",
    "y": "100"
  },
  "appearance": {
    "type": "speedometer",
    "speedowidth": 180,
    "speedosteps": "10",
    "speedomargin": 5,
    "speedocolor_ok": "#199C0F",
    "speedocolor_warning": "#CDCD0A",
    "speedocolor_critical": "#CA1414",
    "speedocolor_unknown": "#CC740F",
    "speedocolor_bg": "#DDDDDD",
    "speedofactor": "1e3",
    "speedogradient": "-0.15",
    "speedosource": "perfdata:users"
  },
  "label": {
    "labeltext": "",
    "fontcolor": "#000000",
    "fontsize": 20,
    "position": "below",
    "offsetx": -56,
    "orientation": "horizontal",
    "bgcolor": "#C0C0C0",
    "bordercolor": "#000000",
    "bordersize": 1
  }
}
Thruk Dashboard
Thruks next generation Dashboard (also known as the panorama plugin) is a super flexible dashboard framework which allows you to place icons and widgets on a canvas to design all types of dashboards.
| Drop me an e-mail if you have nice screenshots, useful shapes or free iconsets. |
Creating New dashboards
Dashboards can be created by the new tab button next to the open dashboards.
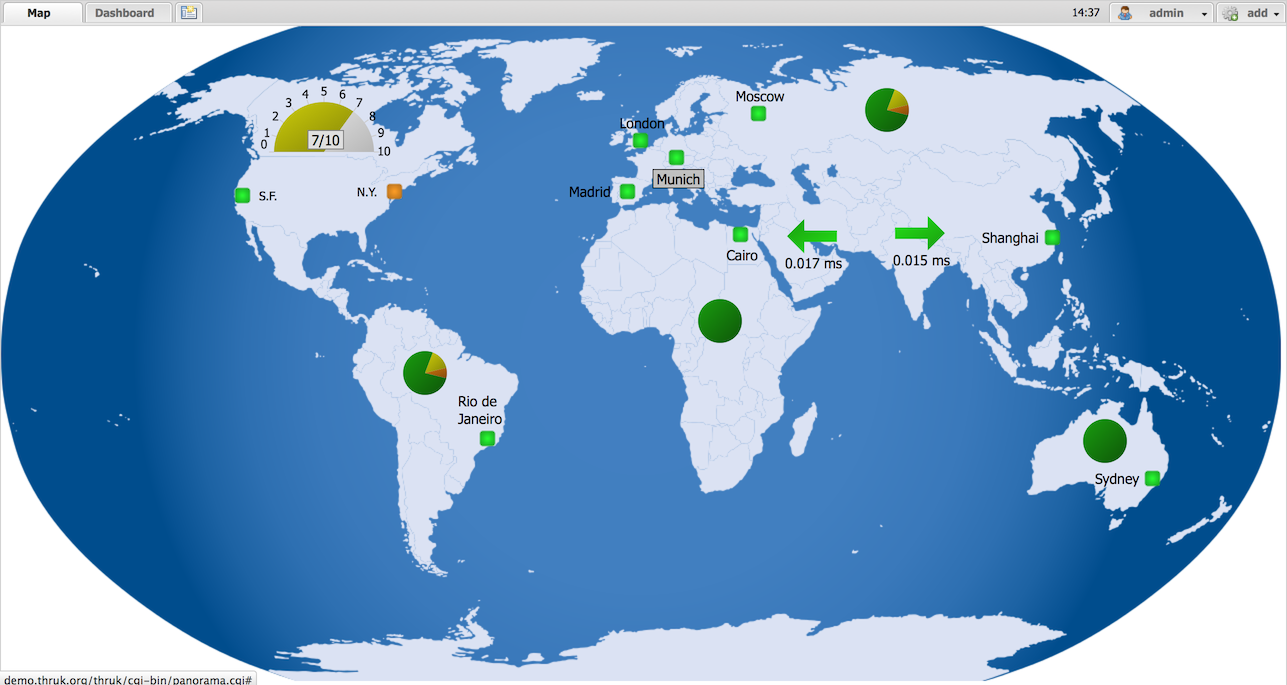
Dashboards and GeoMaps
A normal Dashboard is just a plain empty canvas where elements can be placed. Dashboards can have a background image which can be scaled and moved.
GeoMaps do have a openstreetmap background layer where icons and widgets can be
placed on. While the map is locked with the map lock button in the top left corner
you can work with the dashboard just like a normal one. When the map is unlocked, then
you can navigate the map with dragging and zooming. The world button brings you
back to the default view which can be changed by Set Map Center from the context
menu.
Geo Maps do not store x / y point coordinates for your icons, instead when placing an icon, the position is converted to latitude and longitude coordinates. So when navigating on the map, all icons will stay at their geo coordinates.
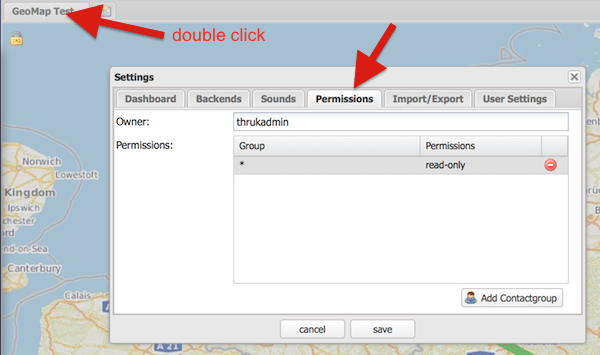
Dashboard Permissions
Dashboards are stored as single maps, but they belong to a specific user. This means if you create a dashboard, only you are allowed to see it. Administrators (contacts with the configuration information and system commands role) can see and edit all dashboards.
Till release v1.86 you could set a dashboard public, so everyone got read-only permissions to that dashboard. Starting with v1.88 a fine granular permission system has been introduced which allows you to assign read-only and read-write permissions to specific contactgroups.
Changing permissions is possible in the permissions tab of a dashboard. Double click the dashboard title to open the settings or choose settings from the context menu.
Export / Import
Dashboards can be exported from the dashboard settings window. The import is available on the same settings window.
Icons, Widgets and Labels
In general you can place icons and widgets on the canvas.
Widgets
Widgets are framed window like panels which contain grids, graphs and all kind of data.
Some widget examples are:
-
Servicetotals Pie Chart
-
Mine Map
-
PNP Graphs
-
Logfiles
-
Business Process Graphs
-
Embedd content from other sites with the generic url panlet
Icons
Icons represent the state of a single host, service or filtered query and are usually placed on a map or background image.
The state can be represented in various types:
-
image icon
-
speedometer
-
pie chart
-
traffic lights
-
arrows and shapes
-
watermarks and lines
Labels
Every icon and widget can have a label. Labels can either be static text or dynamic. Icon settings can either be changed by double clicking the icon itself or by opening the context menu with the right mouse button.
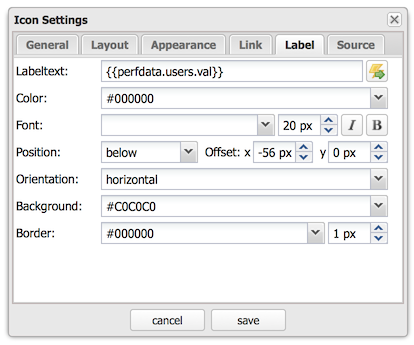
Source:
All examples can directly be used by adding any icon widget and copy & paste the source in the 'Source' Tab. Then hit the 'Apply' button.
On the right side of the label input field is a 'Wizard' button which helps you creating labels in no time. The examples can be put into the textarea by clicking on them.
Editing Dashboards
Editing Dashboards has been made as easy as possible. However there are a few hints and tricks which make things even easier.
Cloning Widgets and Icons
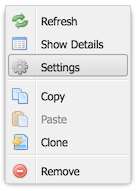
Icons
Once you have configured an icon the way you want, you can clone it from the
context menu. Just right click on the icon and select Clone from the menu.
Then click where you want to place the clone. With the Copy and Paste from
context menu, it is even possible to copy icons from one dashboard to another.
Widgets
Beginning with the release v1.88 it is possible to clone widgets too. In the panel window header, there is a clone button on the top right. After clicking that button, you have to choose the location of the cloned widget.
Restore Points
Since the release v1.88 it is possible to set up to 5 manual restore points. Whenever you made a mistake and want to revert the changes made, just select that restore point from the context menu.
Besides the manual restore points, up to 5 automatic restore points will be created every 10 minutes.
Icon Widget Appereance Types
Icon
Icons are the basic appearance type and are useful for host/service status as well as hostgroups and servicegroups. In case of hosts and services they will change the icon according to the state of the host/service.
Hovering the icon will show the host/service details or in case of groups and filters a summary report for the set of hosts/services.
It is possible to choose a global iconset for a dashboard in the dashboard settings itself. You may then override the iconset for each icon individually.
Shape
Shapes are kind of svg image. They usually contain one closed path which is filled with the color of its state. Again either host/service states are possible or summary states for groups and filtered sets.
Shapes gradient color can be based on performance data when using a single host or service as icon source.
Creating own shapes is easy. Use the svg editor of your choice, for example inkscape, create a path and open the saved svg file with a text editor and look for the path:
For example:
  <path
     style="fill:#000000;stroke:#000000;stroke-width:1px;stroke-linecap:butt;stroke-linejoin:miter;stroke-opacity:1"
     d="m 130,252.36218 200,0 0,-70 105,105 -105,105 0,-70 -200,0"
     id="path2997"
     inkscape:connector-curvature="0"
     sodipodi:nodetypes="ccccccc" />
Then copy an existing shape and replace the path with the value of the 'd' attribute.
Source:
{
  "general": {
    "host": "",
    "service": ""
  },
  "layout": {
    "x": "100",
    "y": "100"
  },
  "appearance": {
    "type": "shape",
    "shapename": "arrow",
    "shapewidth": 50,
    "shapelocked": "1",
    "shapecolor_ok": "#199C0F",
    "shapecolor_warning": "#CDCD0A",
    "shapecolor_critical": "#CA1414",
    "shapecolor_unknown": "#CC740F",
    "shapegradient": "0.1",
    "shapesource": "fixed"
  }
}
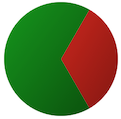
Pie Chart
Pie Charts are perfect for visualizing group and filtered states.
Source:
{
  "general": {
    "hostgroup": "",
    "incl_hst": "on"
  },
  "layout": {
    "x": "100",
    "y": "100"
  },
  "appearance": {
    "type": "pie",
    "piewidth": 120,
    "pielocked": "1",
    "piedonut": 0,
    "piecolor_ok": "#199C0F",
    "piecolor_warning": "#CDCD0A",
    "piecolor_critical": "#CA1414",
    "piecolor_unknown": "#CC740F",
    "piecolor_up": "#199C0F",
    "piecolor_down": "#CA1414",
    "piecolor_unreachable": "#CA1414",
    "piegradient": "-0.15"
  }
}
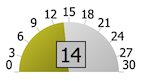
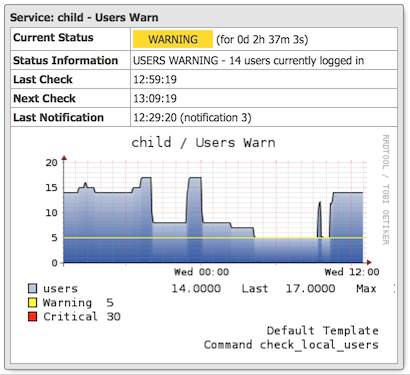
Speedometer
Speedometer are perfect for visualizing performance data for a single host or service. Best used in combination with a label showing the actual value in numeric form.
Source:
{
  "general": {
    "host": "",
    "service": ""
  },
  "layout": {
    "x": "100",
    "y": "100"
  },
  "appearance": {
    "type": "speedometer",
    "speedowidth": 180,
    "speedosteps": "10",
    "speedomargin": 5,
    "speedocolor_ok": "#199C0F",
    "speedocolor_warning": "#CDCD0A",
    "speedocolor_critical": "#CA1414",
    "speedocolor_unknown": "#CC740F",
    "speedocolor_bg": "#DDDDDD",
    "speedogradient": "-0.15",
    "speedosource": "perfdata:users"
  }
}
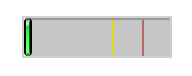
Performance Bar
A Performance Bar is the exact same performance bar as on the normal Thruk status pages.
Source:
{
  "general": {
    "host": "",
    "service": "PING"
  },
  "layout": {
    "x": "100",
    "y": "100",
    "zindex": "0"
  },
  "appearance": {
    "type": "perfbar"
  }
}
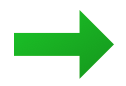
Trend Icon
The Trend Icon determines the current trend based on collected performance data and displays an arrow (or other icons) if the current delta value hits certain thresholds. The Trend Icon can fetch initial performance data from pnp4nagios and will then collect performance data with every status refresh.

Source:
{
  "general": {
    "host": "",
    "service": "PING"
  },
  "layout": {
    "x": "100",
    "y": "100",
    "zindex": "0"
  },
  "appearance": {
    "type": "trend",
    "trendiconset": "default_64",
    "trendsource": "perfdata:rta",
    "trendfunctionin": "average",
    "trendrangein": "5m",
    "trendfunctionvs": "average",
    "trendrangevs": "12h",
    "trendoffsetvs": "0m",
    "trendfixedvs": "1",
    "trendverygood": -10,
    "trendgood": -5,
    "trendverybad": 10,
    "trendbad": 5
  }
}
Text Label
Text Labels are static text items which can be placed everywhere where you need additional text.

Source:
{
  "layout": {
    "x": "100",
    "y": "100",
    "rotation": 45
  },
  "label": {
    "labeltext": "Text Label",
    "fontcolor": "#000000",
    "fontfamily": "",
    "fontsize": 14,
    "fontitalic": "",
    "fontbold": "",
    "position": "below",
    "offsetx": 0,
    "offsety": 0,
    "orientation": "horizontal",
    "bgcolor": "",
    "bordercolor": "",
    "bordersize": 1
  }
}
Static Image
Static images are a good way to add images to your map without having to change the background image itself.

Source:
{
  "general": {
    "src": "../usercontent/images/fear_and_loathing.jpg"
  },
  "layout": {
    "x": "100",
    "y": "100"
  }
}
Scripted Dashboards
Besides the hand-crafted dashboards, it is possible to use Scripted Dashboards as well.