Introduction
Thruk is a multibackend monitoring webinterface which currently supports Naemon, Nagios, Icinga and Shinken as backend using the Livestatus API. It is designed to be a 'dropin' replacement and covers almost 100% of the original features plus adds additional enhancements for large installations and increased usability.
Main Features / Advantages
-
Multiple backends
-
Faster, no need to parse status.dat for every request
-
Less CPU usage
-
Display live data, no delay between core and GUI
-
Independant from monitoring core, can be installed on remote host
-
Clusterable, can be clustered over hosts
-
Change status.cgi filter inline
-
Extended logfile search
-
Better logging, uses log4perl (who submitted which command?)
-
Valid HTML code
-
No frames (can be reenabled for better addon integration)
-
Easy to extend with plugins
-
Pagination
-
Multiple themes included
-
Excel export for status and logfiles
-
Adjustable side menu
-
Full expanded plugin commandline for easy testing
-
Save searches in personal bookmarks
-
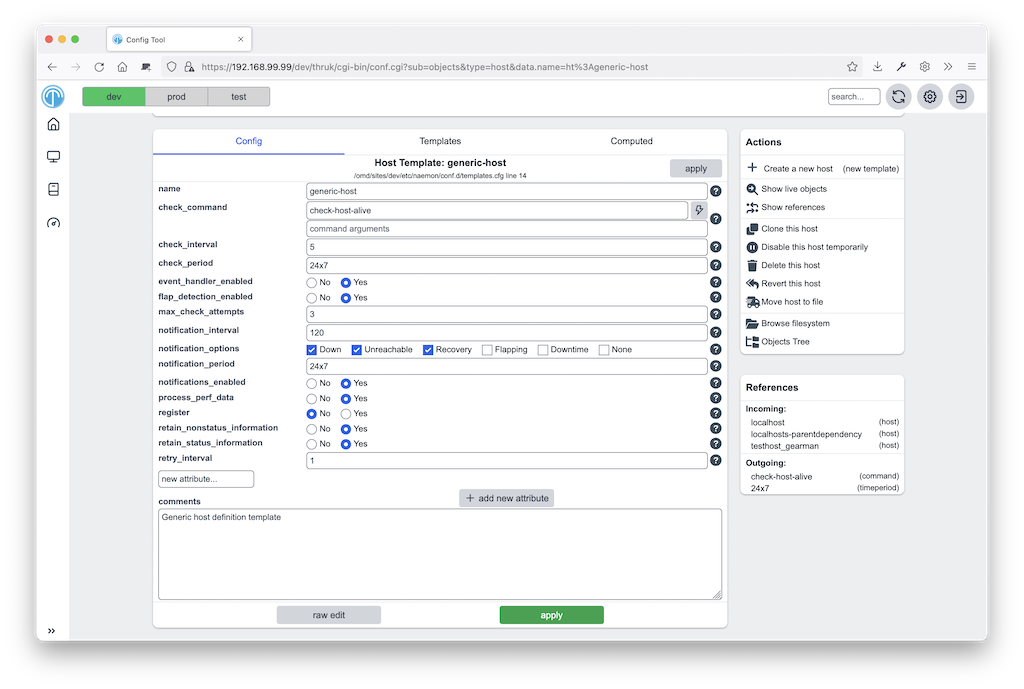
Config Tool included
-
Mobile interface included
-
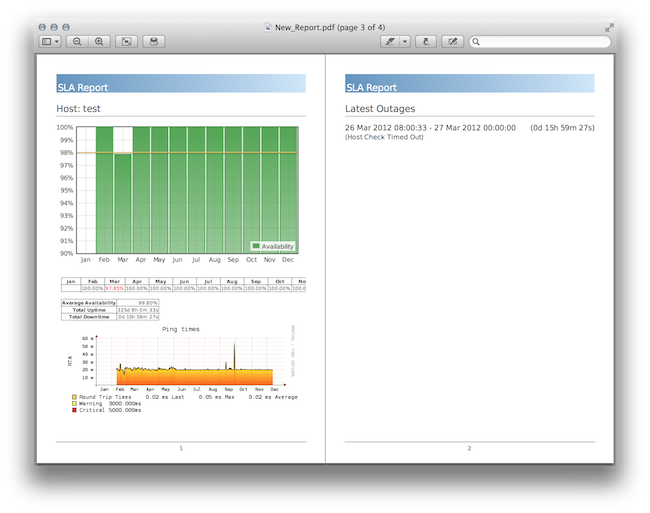
SLA Reports in PDF format
-
Recurring Downtimes
-
Fully Featured Dashboard
-
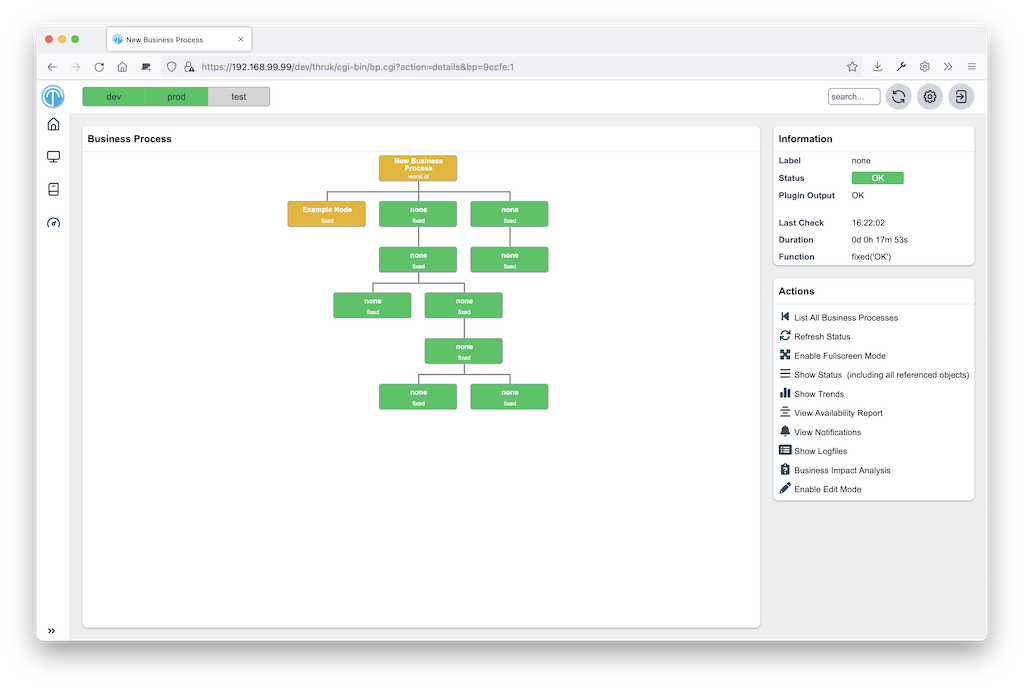
Business Process Addon
How it works
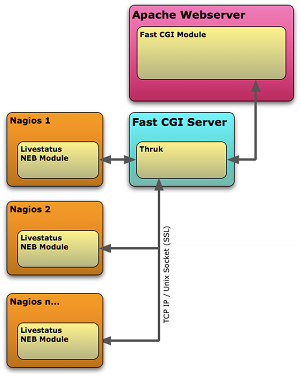
Thruk is written in Perl using the Plack Framework. Backend monitoring systems will be connected with the Monitoring::Livestatus Perl Module. Thruk itself is running as a fastcgi process. Availability will be calculated with Monitoring::Availability. Authentication is provided by the Apache webserver (For example with mod_auth_basic, mod_auth_ldap, mod_auth_mysql, …).
Reasons to choose Thruk
There are a couple of cool things in Thruk. A few of them are listed here.
Multi Site Support
Thruk connects to as many cores as you want. You could even combine Naemon, Nagios, Icinga and Shinken instances into one big combined view. That way you get the advantage of several independent locations and still have an overview about all your installations. Sites can be put into groups for better arrangement.
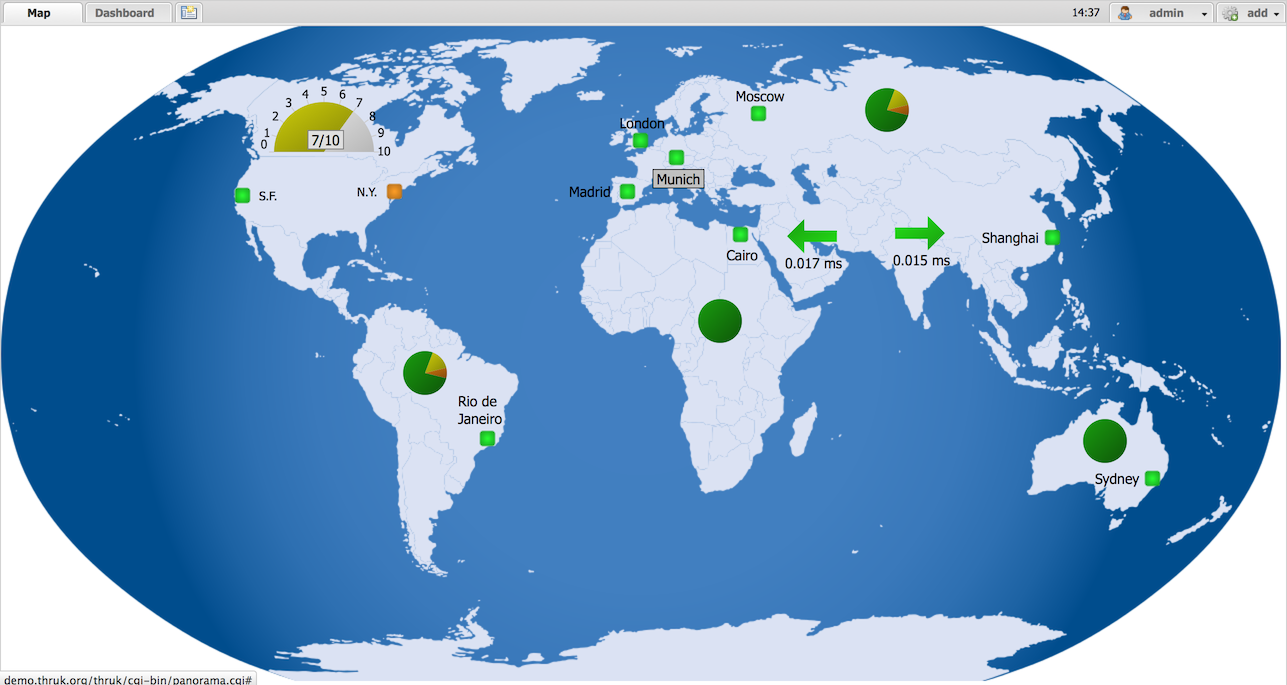
Flexible Dashboard
Thruk panorama plugin provides a super flexible dashboard solution. Every user can build its own dashboards with a few clicks and share them to colleagues. Various elements and backgrounds and images can be positioned free without any constrains. Multiple Dashboards can be linked together and connected to actions. This allows you to create your own control center.
SLA Reports
The 'reporting' plugin creates comprehensive SLA reports in HTML and PDF format which may be send by mail at regular intervals. Besides that you may turn any page in Thruk into a regular E-Mail report.
Business Process Integration
Using the Business Process addon allows modeling your important applications and business processes. Online editor and notifications included.
Excel Export and Bookmarks
The Bookmarks feature allows you to save your searches and add them as your personal menu item. Besides the bookmarks, you can adjust the menu easily with the menu_local.conf for all users.
The Excel export creates real Excel files which can be send by mail or used to extract hostnames and other information.
Config Tool
The Config Tool makes is very easy to change object configuration of your monitoring solution. It also allows you to make quick changes to your Thruk configuration, as well as managing user access via htpasswd files or adjusting your cgi.cfg.
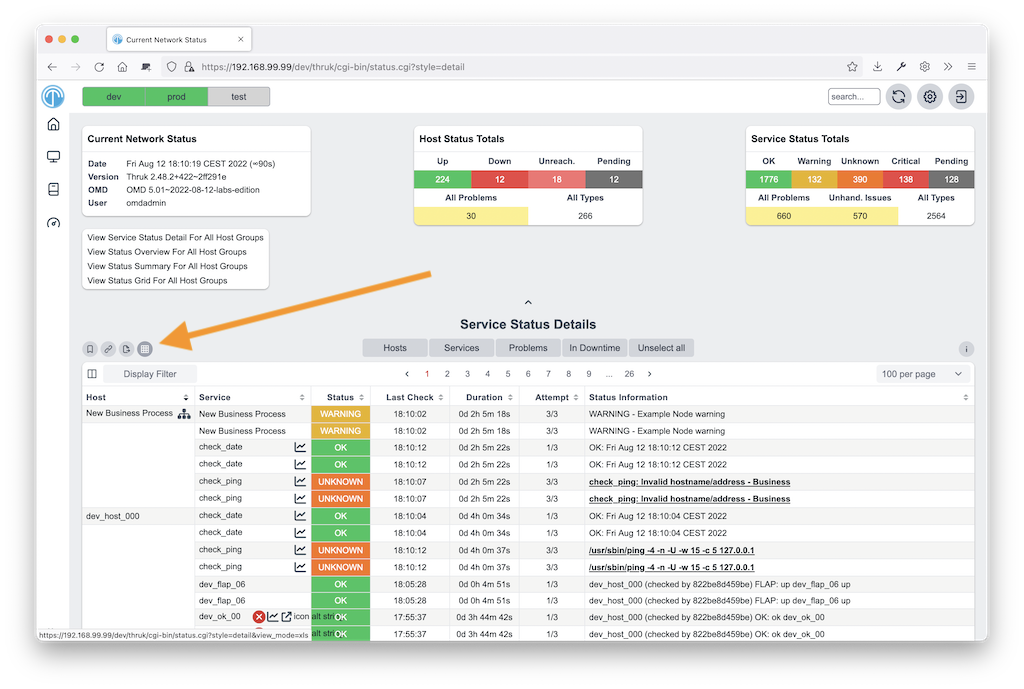
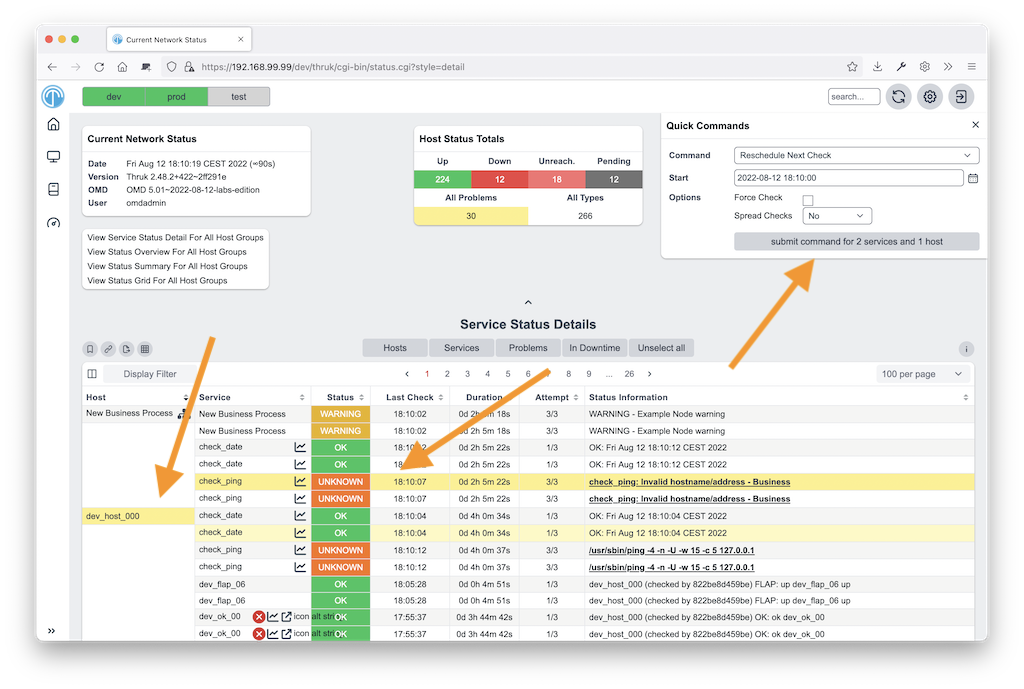
Sending Multiple Commands
The new status pages makes it very convenient to send multiple commands at once. It is even possible to send host and service commands at the same time. When rescheduling hosts and services, Thruk will wait until your check is finished and display the result as soon as the check has come back.
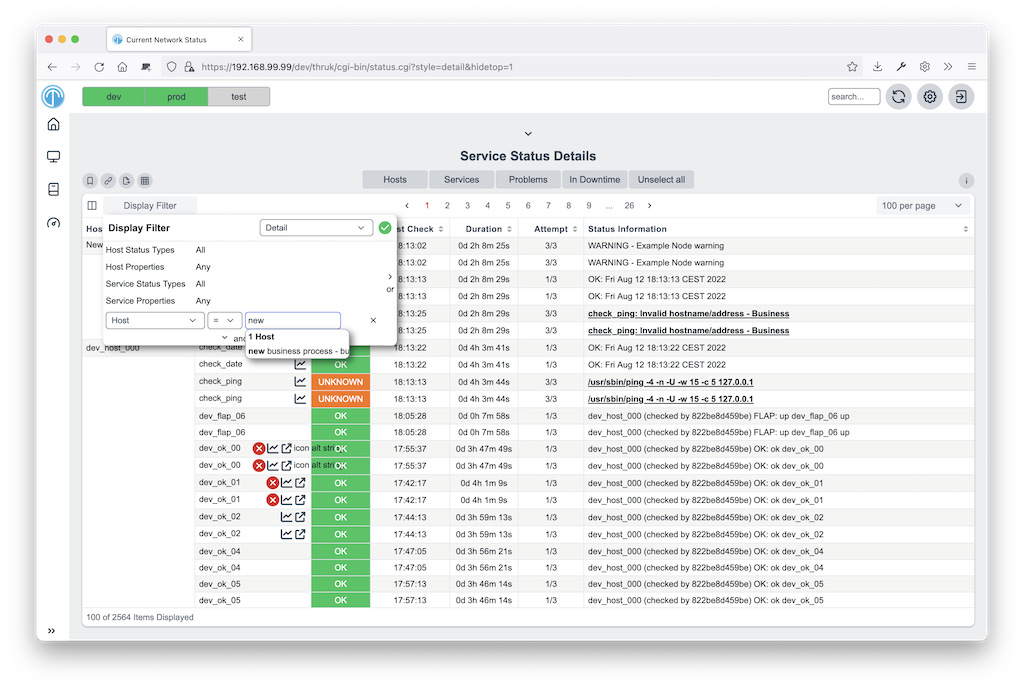
Easy Filtering
Remember the days when you had to guess numbers in the url to filter hosts or services. With Thruk it’s possible to quickly change your display filter. You can combine multiple filter to create whatever views you like. An Ajax search supports you, so you don’t have to guess host or service names, plus you get the power of regular expressions.
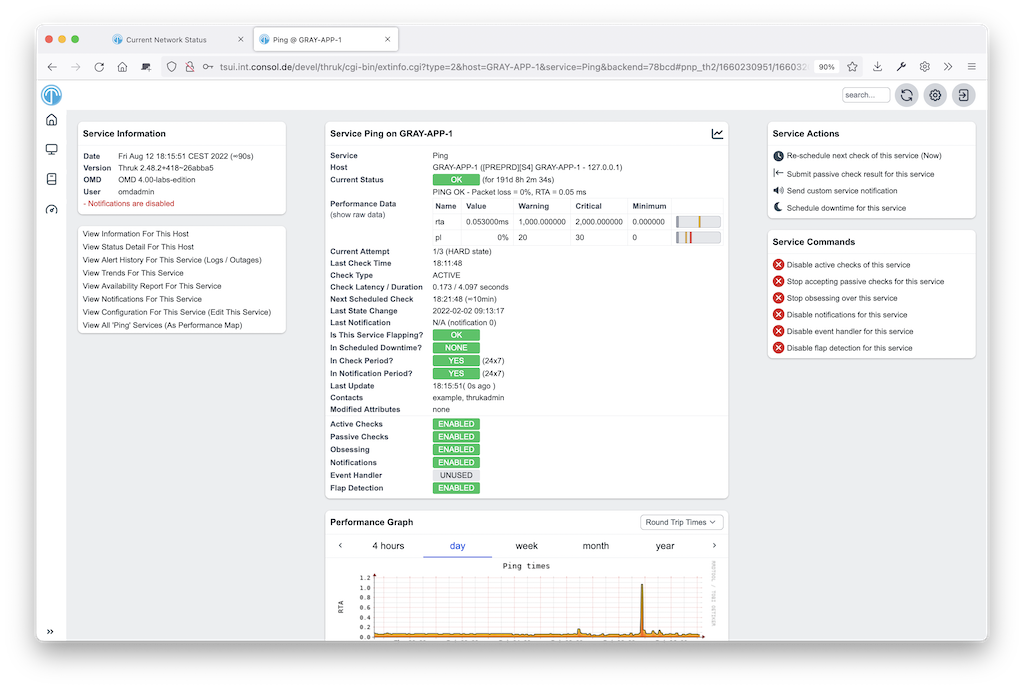
PNP4Nagios Graphs
When your action_url contains /pnp4nagios/, there will be automatically a graph displayed for your host and service. This gives you a quick view about the performance history. The image is then linked to PNP4Nagios to get detailed information.
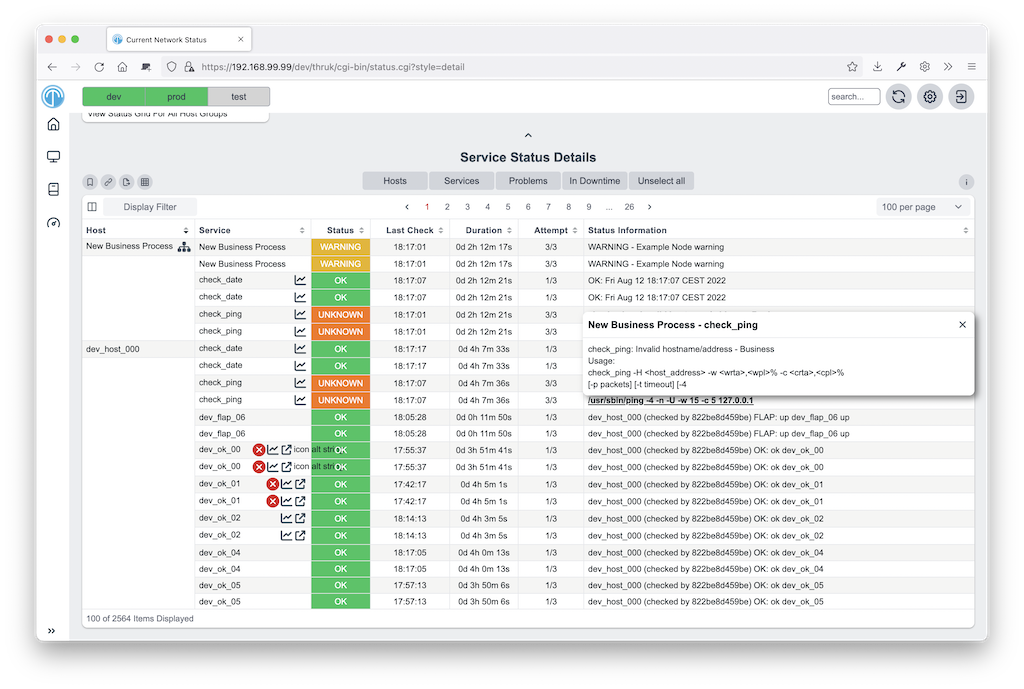
Multiple Lines of Plugin Output
When your check returns multiple lines of plugin output. Thruk marks the output in blue and a click on it displays the complete output. This is especially useful for check_multi checks. In addition to that, the comments and downtimes also have a small popup with their data. So you don’t have to open the host/service page just to see who set a comment and when there is a downtime.
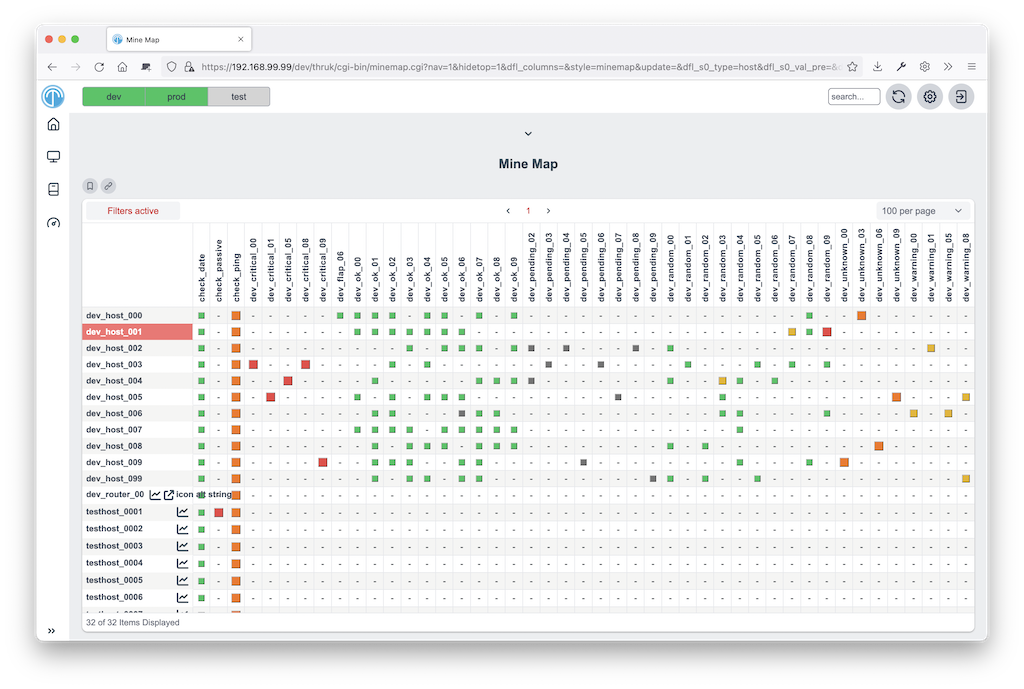
Mine Map
The Mine Map is the perfect tool to get a quick overview. It is especially useful if you have a lot of common services across your hosts. Otherwise use hostgroups or servicegroups for nice results. Normal filtering is possible too.